
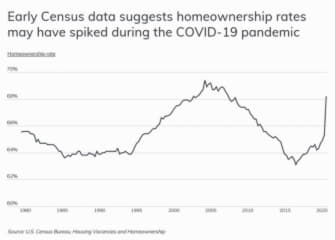
While homeownership has been on the rise since 2016, and early data suggests it could be surging during COVID-19, the national homeownership rate remains below peak levels and out of reach for many Americans. Prior to the pandemic, approximately 36% of households in the U.S. were renter-occupied and 64% were owner-occupied, but in certain areas renters significantly outnumber homeowners.
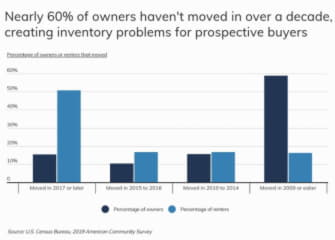
Prospective home buyers face many challenges, including a lack of inventory and rising prices, which is keeping homeownership rates low in certain areas. Many older homeowners don’t want to move, which limits available options for first-time buyers. According to data from the U.S. Census Bureau, about 60% of current homeowners bought their home in 2009 or earlier and haven’t moved since. By contrast, about half of current renters moved into their current residence in 2017 or later.
Furthermore, a long period of low housing inventory has driven up prices and made it more difficult for the average worker to afford a home. Data from Zillow shows that the current median home price nationwide is $256,663, pricing many Americans out of the housing market. In fact, the national median household income for a homeowner is $81,988, nearly twice the median household income of a renter ($42,479).
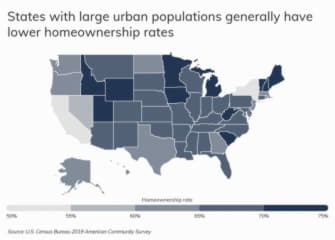
As a result of geographic differences across these factors, homeownership rates vary significantly by location. At the state level, homeownership rates range from a low of 53.5% in New York to 73.4% in West Virginia. In general, coastal states with expensive and densely populated urban areas, such as New York and California, tend to have some of the lowest homeownership rates in the country. By contrast, many states in the Midwest such as Minnesota and Wyoming are known for their affordable housing, and tend to have higher homeownership rates.
To find which cities have the lowest homeownership rates (and the most renters), researchers at Roofstock analyzed housing data from the U.S. Census Bureau 2019 American Community Survey 1-Year Estimates. To improve relevance, cities were categorized by population size: small (100,000–149,999), midsize (150,000–349,999), and large (350,000 or more). All housing data presented below comes from 2019, when the homeownership rate nationwide was 64.1%.
The analysis found that in Boston, 34.7% of all homes are owner-occupied while renters occupy the other 65.3%. Owner-occupied households in Boston report a median household income of $132,762, compared to just $56,291 for renters. Out of all large U.S. cities, Boston has the 3rd lowest homeownership rate. Here is a summary of the data for Boston, MA:
- Homeownership rate: 34.7%
- Owner-occupied housing units: 94,202
- Renter-occupied housing units: 177,351
- Median household income (owners): $132,762
- Median household income (renters): $56,291
- Median home price: $653,078
For reference, here are the statistics for the entire United States:
- Homeownership rate: 64.1%
- Owner-occupied housing units: 78,724,862
- Renter-occupied housing units: 44,077,990
- Median household income (owners): $81,988
- Median household income (renters): $42,479
- Median home price: $256,663
For more information, a detailed methodology, and complete results, you can find the original report on Roofstock’s website: https://learn.roofstock.com/blog/lowest-homeownership-rates

