
Summary
- Berkshire's huge cash amount looks less extreme when compared to equity and assets, which have also grown considerably.
- When compared to float, the cash position seems to be getting near where in past instances, significant cash deployment has followed.
- Impossible to know if this is putting cause and effect in the right order, but if history is any guide, Buffett appears to dislike cash on hand exceeding float.
- Due to lagging Berkshire valuation relative to everything else and size of cash to be deployed, buybacks seem to be the only reliable alternative for Buffett today.
A lot has been written about Warren Buffett's cash pile at Berkshire Hathaway (NYSE:BRK.A)(NYSE:BRK.B), which at the end of the first quarter reached an all-time high of about $137 Bln. Given how much the company itself has grown, I have looked at the cash relative to other balance sheet items, to try and assess if such amount of cash represents such a conservative position, as assumed by most.
Methodology
The exercise is very simple. Berkshire publishes on its website all the 10-Qs going back almost 25 years, to year-end 1995. I took the main balance sheet values form the ninety-eight quarters and put them into Excel table to try and find some useful ratios of cash level to other balance sheet items.
Cash as compared to equity and total assets:

Source: 1995 - current 10-k, 10-Q and author chart
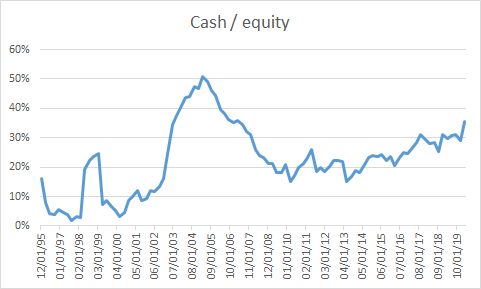
Source: 1995 - current 10-k, 10-Q and author chart
Definitely, the trend during the last decade is upward, with more cash accumulating in relation to both total assets and equity. No surprise here, but it is worthwhile to note that it is also not at "extreme" levels. The peak happened in 2004, at 23% of assets and 50% of equity.

